OSO-7
Orbiting Solar Observatory-7
Solar X-ray Experiment
Soft X-ray Detector | Hard X-ray Detector | Particle Detectors | Electronics | Performance
The flux histories of the solar fluence were produced in two energy bands on a daily basis. The soft x-ray band of 5.1-6.6 and the hard x-ray band of 21-32 keV were used to produce the 1-minute rates that were searched for evidence of solar flares. The gradual phase soft x-ray component was generally clearly separated form the hard x-ray impulsive phase of flares in such plots. Each flare time history was then re-plotted with 10.24 s resolution.
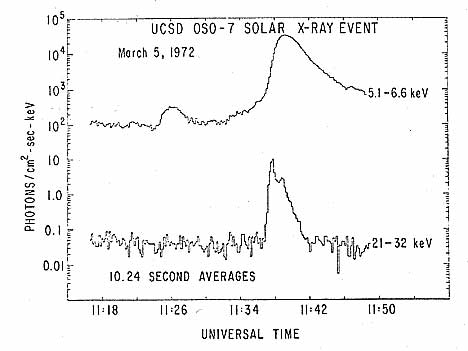 The solar flare of March 5, 1972 was classified as an N subflare located at S07 E40, and is shown to the left. The pulse height counting rates have been converted to fluxes using approximate conversion factors. These factors take into account photon detection efficiency, energy resolution, iodine k-escape probability, and the channel to energy conversions. A constant background before and after each flare was also assumed, and these regions for the March 5, 1972 flare are indicated in the plot.
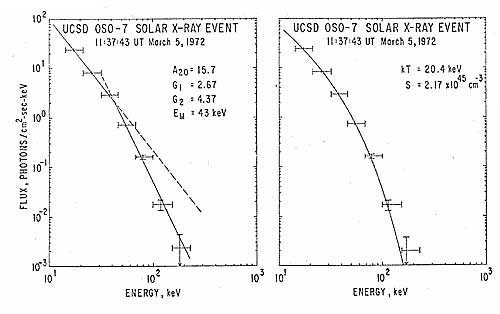 The spectrum of this event can be interpreted in two ways: 1) a broken power law that has one index (-2.67) up to a break energy (43 keV) and a second index (-4.37) beyond that, or 2) an exponential with a characterstic temperature (20.4 keV) and emission measure (2.17x1045 cm-3). The error bars shown are the estimated statistical errors in the actual pulse height channel counts converted via the detector model into equivalent flux. The statistical errors of the first four channels are too small to be shown.
OSO-7 Information
Mission Objectives
Spacecraft
Cosmic X--ray Experiment
Solar X--ray Experiment
Results
Publication