The UCSD/MIT Hard X-ray and Low Energy Gamma-Ray Experiment for HEAO 1

J. L. Matteson
Center for Astrophysics & Space Sciences
University of California, San Diego.

Presented at the AIAA 16th Aerospace Sciences Meeting, Huntsville, Alabama, January 16-18, 1978.


Contents:

  1. Introduction
  2. Instrument Concept
  3. Instrument Design
  4. Instrument Performance
  5. Sensitivity
  6. Acknowledgements & References

Abstract

Primary scientific objectives of this experiment are the measurement of the spectra and time variations of discrete sources and the spectrum and isotropy of the diffuse background, all in the 10 keV to 10 MeV energy range The instrument consists of an array of 7 NaI(Tl)/CsI(Na) phoswich-type detectors and 8 large CsI(Na) shields. In order to achieve the maximum sensitivity allowed by weight, data rate and funding constraints of the mission, three detector and aperture geometries were selected. The instrument's total sensitive area is 494 cm2. The fields of view vary from 1.7° × 20° FWHM at low energies to 43° FWHM at high energies. The basic instrument concepts, details of the mechanical and electrical design, and pre- launch calibrations are presented In-orbit performance is described and background measurements are analyzed and used to estimate the experiment's ultimate sensitivity.


Figure 1
Figure 1:
The Hard X-ray and Low Energy Gamma Ray Experiment

I. Introduction

The basic scientific objectives of the Hard X-ray and Low Energy Gamma-Ray Experiment are:

  1. Measure the spectrum and isotropy of the cosmic background in the 100 keV to 10 keV range.
  2. Measure the spectra and time variations of discrete cosmic sources in the 10 keV to 10 MeV range.
  3. Search for cosmic spectral lines with the energy resolution that can be obtained with space hardened NaI(Tl) scintillation counters.

This experiment1, is the most recent in a series of NASA satellite experiments which use collimated scintillation counters to study sources of cosmic x-and gamma-rays at energies above 7 keV. The properties of representative instruments are indicated in Table 1. The trend toward greater collecting areas, and narrower fields of view in more recent instruments is evident. The difficulties of collimating and shielding detectors at energies above 200 keV has made sensitive observations difficult at higher energies. In addition. the problem of induced radioactivity in the detectors has further reduced sensitivity. by raising the instrumental background, and made data interpretation difficult.

Table 1: Collimated scintillation counter experiments
Vehicle Launch Date Energy Range (keV) Area (cm²) Field of View (°FWHM) P.I.
OSO-3 3/67 8 - 210 10 22 Peterson - UCSD
OSO-7 9/71 7 - 550 64 6.5 Peterson - UCSD
OSO-8 6/75 20 - 5000 25 5 Frost - GSFC
HEAO-1 8/77 10 - 10000 494 1.7 - 43 Peterson - UCSD
& Lewin - MIT

[Figure 2]
Figure 2:
Angular Response
The HEAO-1 instrument is intended to overcome these difficulties by optimization of the detector area, thickness, shielding and collimation in order that significant sensitivity improvements may be obtained across its entire energy range. The optimization criterion is that the counting rate due to the cosmic background flux passing through the instrument aperture is equal to the counting rate due to the internal background of the instrument2. In this case elimination of the internal background, possibly by the use of extremely thick shielding, could result in only a 1/(2½) improvement in sensitivity. Since the x- and gamma-ray mean-free-path and the cosmic background spectrum are energy dependent, the optimization criterion is normally satisfied at a single energy. Below this the aperture flux is dominant and at higher energies the internal background is dominant.

II. Instrument Concept

The instrument concept is the result of several fundamental considerations:
  1. NaI(Tl) scintillation counters have good energy resolution and efficiency and have been used in previous space programs. Therefore they were chosen for the detectors.
  2. The dominant interaction mechanism of x-and gamma-rays at 1 MeV is Compton scattering. Here the energy of the incident photon is shared by a recoil electron and a recoil photon. Therefore effective shielding at 1 MeV requires using the Compton electrons as an anticoincidence of inter- actions in the detector. NaI(Tl) and CsI(Na) was selected since it is relatively easy to machine to complex shapes and is more rugged than NaI(Tl). (An alternative would be to use extremely thick passive shields which degrade photons by Compton scattering until they are finally absorbed by the photoelectric effect. Such shields are far too massive for use at this time. but may have future application as heavier payloads become possible with the Space Transportation System.)
  3. The background properties of a shielded scintillator are sufficiently close to optimum over only a factor of ten, or so, in energy. Therefore, three detector, shield and aperture geometries are required to effectively cover the instruments energy range. Above 200 keV the circular apertures defined by the shields would be satisfactory. However, at lower energies narrow apertures which can resolve the several hundred known X-ray sources3 as well as cover the wider apertures of the higher energy detectors are required.
  4. At energies low enough that the photoelectric effects is dominant in a material, that material is effective as a passive shield or collimator Therefore passive collimators were selected to give the narrow fields of view required at low energies.
  5. Measurement of the cosmic background is best done in an instrument which has negligible internal background or one that produces a measurable modulation of the cosmic background. Since experience indicated the former could not be obtained, the instrument is equipped with a movable shield which could block any detector's aperture, and thus remove a known fraction of the cosmic background from the detector's counting rate. This device is called the "blocking crystal."
  6. Sporadic fluxes of charged particles map reach the detectors and mimic x- and gamma-rays. To eliminate this effect the instrument has an aperture shield of thin .NE l02 scintillator which is nearly transparent to X-rays but can detect and discriminate against charged particles.

III. Instrument Design

Detectors:

The instrument is shown in Figure 1. It has a mass of 120 kg and measures ~82 cm dia. x ~82 cm long. The detectors are of the "phoswich" type. Here a NaI(Tl) detector and a CsI(Na) shield segment are optically coupled and viewed by a single photomultiplier (PMT). The major advantage is that the CsI(Na) shield does not have to surround the PMT, resulting in a lighter and less expensive shield. In addition, the passive mass of the PMT is isolated from the detector, improving spectral response and background suppression NaI(Tl) and CsI(Na) interactions are distinguished by their different scintillation decay times. ~0.25 µs and ~0.8 µs, respectively. Their decay time is measured by a pulse-shape-analyzer (PSA) and those with sufficiently large decay-time are rejected as shield events.

[Figure
Figure 3:
ME detector spectral response
The detector and shield properties are given in Table 2. The detector parameters obtain a wide range of values in order to optimize performance over the instrument's energy range. The single High Energy Detector (HED) is located at the center of the instrument. It has a wide field of view and is shielded by ~15 cm of CsI(Na). Surrounding it are four Medium Energy Detectors (MED) and two Low Energy Detectors (LED). They have narrower fields of view and less shielding. 10 cm and 5 cm, respectively. The LED slat collimators are of graded-Z construction in order to eliminate characteristic K X-rays from the LED background. The primary material is tin, which protects <1% off-axis transmission at energies below 130 keV and ~15% transmission at 200 keV. Grading is provided by layers of copper and chromium plating. The collimators obstruct 14% of the LED area. They are aligned at 60° to the HEAO-1 scan direction, resulting in crossed fan-views which extend 20° from the scan plane. Each LED sights an x-ray source at a different time, the difference being a function of the source's angle from the scan plane. Thus correlation of the data from the LEDs allows source positions to be determined to < 1° accuracy.


Table 2: Detector and Shield Properties
Name No. in Inst. Material Thickness (cm) Area (cm²) Field of View (°FWHM) Energy Range
High Energy Detector (HED) 1 NaI(Tl) 7.5 120 43 0.3 - 10 MEV
Medium Energy Detector (MED) 4 NaI(Tl) 2.5 42 16 0.08 - 2 MeV
Low Energy Detector (LED) 2 NaI(Tl) 0.3 103 1.7 × 20 10 - 200 keV
Inner Shield 2 CsI(Na) 5 N/A 100 keV
Outer Shield 6 CsI(Na) 5 N/A 100 keV
Blocking Crystal 1 CsI(Na) 4 - 7 N/A 100 keV
Aperture Shield 1 NE102 1.0 (HED)
0.5 (MED)
0.15 (LED)
N/A N/A 100 keV
Particle Monitor 3 NE102 N/A N/A N/A Protons:
20 - 60, >20 MeV60 MeV
100 - 140, >100 MeV
Electrons:
>1 MeV
>6 MeV
>20 MeV

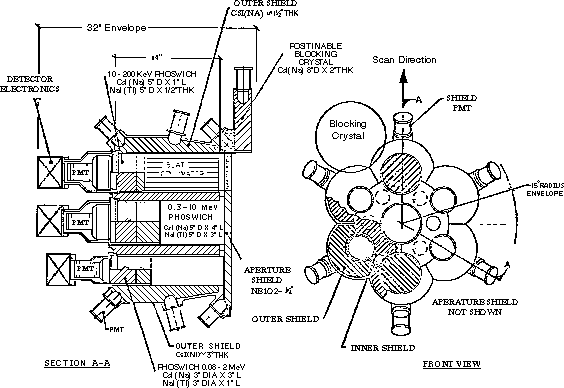
The CsI(Na) shield is partitioned into 8 elements. The inner (outer) shields are viewed by 3 (2) PMTs. Each shield and detector is contained within its own mechanical housing. The shields are cushioned against their housings by silicone rubber. Shield PMTs are spring loaned and cushioned against the CsI by silicone rubber. The detectors are in hermetically sealed containers with quartz windows. The detector PMTs are coupled with cast silicone rubber and then spring loaded against the quartz window. A small 241Am doped CsI(Tl) scintillator is contained within each detector and shield. These operate as "light pulsers," producing nearly constant amplitude scintillation light pulses due to the alpha-decay of the 241Am. A sharp spectral feature results which is used for relative gain calibrations.

The aperture shield covers the front of the instrument. It contains a 1 cm thick NE102 scintillator which is viewed by 4 PMTs. The NE102 thickness is reduced over the MED and LED apertures to provide improved low-energy x-ray transmission. The LED transmission is ~50% at 10 keV, ~85% at 20 keV and > 90% above 50 keV.

The blocking crystal and its drive mechanism are positioned above the aperture shield. The blocking crystal is viewed by 2 PMTs and provides the same anticoincidence function as the large CsI(Na) shields. The drive mechanism uses servo-controlled lead screws for X- and Z-axis motion to each detector's aperture and to a "home" position away from the apertures. The large gear-reduction of the drive mechanism results in sufficient mechanical advantage to securely maintain the blocking crystal position. Therefore, Voltage is applied to the motors only during motion to the desired position.

The instrument contains three particle monitors not shown in Figure 1, which measure the proton fluxes in three energy ranges . They provide data necessary to correct the detectors' background for induced radioactivity due to proton interaction, in that instrument and the spacecraft. Each particle monitor contains a small NE102 scintillator, a PMT and a passive shield, which sets the proton energy threshold.

The instruments major load-bearing structures are the eight CsI(Na) shield housings and the three spacecraft interface struts . These elements are pinned and screwed together, forming a stiff assembly. As a result, the instrument has a single major resonance at 100 Hz due to the oscillation of the instrument as a 320 kg point mass suspended by the struts . An isolated CsI shield and housing typically has a broad resonance in the 100-300 Hz range.

Electrical:

The electrical system contains several subsystems. These are located so that all detector and shield analog electronics are as near their signal source as possible. Digital electronics are contained in the Digital Processor Unit (DPU). which is installed in the spacecraft ~1 meter from the instrument. The DPU-to-instrument interface consists of only logic signals and conditioned low voltage power. The experiment electrical interface with the spacecraft is made at the DPU with the exception that analog monitors are output to the spacecraft at the instrument.

Energy losses in detectors are processed by conventional nuclear-pulse amplifiers and threshold discriminators. The pulse-shape-analyzers are a double differentiator type using RC differentiators. Linear rundown pulse-height-analyzers (PHA) are used. 512 PHA channels are provided for the HED and MEDs and 64 for the LEDs. Each detector's lower threshold discriminator has 4 commandable levels to provide energy range selection. The pulse-shape-discriminators have 32 commandable levels in order to compensate for scintillation decay-time changes with temperature. Shield energy losses above 1O0 keV trigger threshold discriminators. Within the DPU the shield and detector discriminator outputs are combined to generate the anticoincidence signal for each detector. A variety or combinations may be selected by command for each detector. Pulse height data are formatted in the DPU, optional time tagging (~0.1 s, 2 ms or 40 µs accuracy) or shield discriminator tagging is added, and the data are output to telemetry in an event-by-event mode. Good spectral and time resolution result, but the total Throughput for the detectors' PHAs is limited to 100 event/s by the instruments bit rate. The detectors' size and energy, range here selected such that this limitation could not be exceeded by the detectors' background rates. However, complex telemetry allocation among the detectors is still required to insure that high priority x-and gamma-ray events are output to telemetry. All discriminators' rates are output to telemetry at least each 40.96 s. Shield anticoincidence deadtime is output each 10.24 s. The number of detector interactions that satisfy the shield anticoincidence are output each 0.64 s (LED), 5.12 s (LED) and 10.24 s (HED). These data are required to correct the detector PHA data for telemetry deadtime. The telemetry allocation around the instrument's data sources is given in Table 3.

Analog outputs from all detectors and shields are routed to the input multiplexer of the Roving- Pulse-Height-Analyzer (RPHA). The RPHA dwells on a specified input and accumulates a 256-channel pulse height spectrum. Dwell duration and input sequence are selected from many commandable options. Various coincidence, anticoincidence and spectrum segment addressing conditions produce spectra in which critical calibration quantities, such as energy loss peaks and discriminator thresholds, are easily recognized Direct verification of shield anticoincidence is also possible. In addition, the RPHA provides an alternate data channel for a detector which requires higher throughput than its dedicated PHA provides.

Each PMT in the instrument has its own high voltage power supply with 8 or 32 commandable levels. Level changes may be used to select different energy ranges or correct for gain drifts.

Data buffers and telemetry:

The CPU contains a Gamma-Ray Burst Processor (GRBP) which analyzes energy losses in the CsI(Na) shield and blocking crystal array in order to detect cosmic gamma-ray bursts. Energy losses in the 0.09-1.23 MeV range are sampled each 0.32 s and tested against a threshold. If the threshold is exceeded a rapid sampling mode is enabled and 5 channels of intensity and spectral data are sampled with high time-resolution and stored in a memory which has a capacity of ~1600 samples. When the memory is filled its contents are output to telemetry. The memory is required in order to eliminate the brief period of high bit rate to (~103-1O4 b/s) that would be required to output gamma-ray burst measurements in realtime. The GRBP threshold condition, spectral range background averaging intervals and time resolution are selected by command. The GRBP is based on a small spaceflight computer developed at the Goddard Space Flight Center. The computer controls all data sampling, formatting and output. Event accumulation is performed in peripheral hardware.

In order that no single point failure cause the loss of instrument operation, the DPU contains redundant subsystems which perform critical functions. These are command decoding, command status readout, telemetry formatting, detector PHA data sampling, telemetry synchronization with the spacecraft, blocking crystal position control and DC-DC conversion.

Table 3: Telemetry Allocations
Data Type Data Rate
(bps)
Analog Housekeeping 12.5
Digital Housekeeping 12.5
Gamma-ray Burst Processor 25
Accumulators 125
Roving pulse-height-analyzers 100a
Detector pulse-height-analyzers 725
Total 1000
a 0. 100, 200, 400 or 800 bps may be commanded. Detector pulse-height-analyzers rate changes to maintain total.

IV. Instrument Performance

Prior to launch the instrument response to laboratory sources of x- and gamma-rays was determined. The detectors' sensitivity as a function or angle to the source was measured at several energies. In Figure 2 the HED response is shown at 1275 keV. These data indicate the aperture is 43° Full-Width-at-Half-Maximum (FWHM) and that response at large angles is in the 2 to 10% range, depending on the azimuth. The thinner outer shields of the LEDs account for the relatively high response in the X-Y plane at angles greater than 30°.

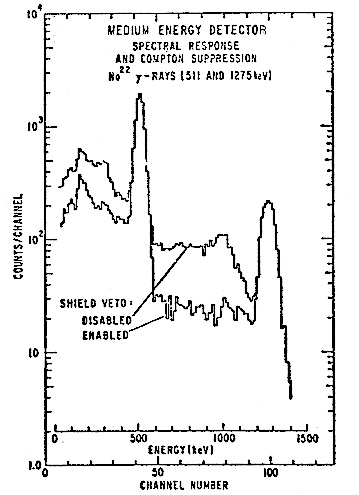
The spectral response of the detectors was measured at many energies. Figure 3 shows the MED response to Na22 gamma-rays. The peaks are due to total absorption of the gamma-rays. The FWHM width of the peak expressed as a percentage of the energy loss is a measure of the detector's energy resolution. Comparison of the spectra with the shield veto anticoincidence enabled and disabled indicates the effectiveness of the shield veto at suppression of response at less than total absorption. The improved spectral response provided by the shield veto allows more reliable interpretation of spectral observations of cosmic sources.

[Figure 4]
Figure 4:
In-orbit PHA spectra
Pre-launch energy resolution at 662 keV was 8 to 9% for the MEDs (one had degraded to 11%) and 11% (degraded from 9% earlier) for the HED. LED resolution was stable at 25% at 60 keV. Additional instrument properties measured before launch include the spectral response as a function of pulse-shape-discriminator threshold, alignment of the detector apertures, spectral response of each shield and the entire shield array and the sensitivity of the aperture shield and particle monitors to energetic particles.

Data taken early in the mission here compared with pre-launch values to measure performance parameter changes. Detector gains tended to be lower by ~20% and therefore the HVPS level of some detectors was raised. Shield gains were stable to ~10%. Pulse-shape-analyzer properties are measured in spectra obtained with the RPHA. Figure 4 shows two spectra taken in orbit. The peaks are due to NaI(Tl), CsI(Na) and light pulser events. Comparison of the spectra show that the peaks shapen with increasing energy. Pre-launch measurements showed the peaks' width depended on energy, E, as E. This is expected if statistical fluctuations at the PMT photocathode dominate the pulse-shape (decay time) resolution. Laboratory testing showed that at 10 keV the NaI(Tl) and CsI (Na) peaks are clearly resolved. The pulse shape discriminator is normally set at a level corresponding to a decay time of ~ 0.5 µs. Slightly improved spectral response can be obtained by setting the discriminator nearer the NaI(Tl) peak, but the probability of rejecting low energy NaI(Tl) events increases.


LED, MED and HED background spectra obtained with the detectors PHA are shown in Figures 5, 6, and 7, respectively. Several background components are also indicated. The cosmic x-rays in the detectors aperture is the largest component below 70 to 200 keV, depending on the detector tape. "Shield leakage" is the background due to x-rays which penetrate the shield without detection. This component is significant only in 50 to 200 keV range of the LEDs and in the MEDs above 1 MeV. Many spectral lines are seen in the background. Most are due to the decay of radioisotopes formed by spallation of I127 in the detector by cosmic-ray and South Atlantic Anomaly (SAA) protons. MED and HED spectra taken shortly after a pass through the SAA are also shown in Figures 6 and 7. They show buildup of the features around 200 keV and a continuum spectrum above 300 keV which cuts off at ~ 2 MeV. The latter is due to Beta-decay of I128 which is formed by neutron capture by I127, the only stable iodine isotope.

The 28-minute half-life of I128 accounts for the increase of the 0.3-2 MeV spectrum after exposure to the SAA. However, even 10 hours after the SAA exposure the I128 component is clearly seen in the MED and HED background . This persistent I128 must be produced by continuos capture of earth albedo and spacecraft produced neutrons. It accounts for >90% of the 1 to 2 MeV background. At higher energies the HED background remains above the predicted shield leakage and aperture flux components. The origin of this excess is unexplained at this time. The I128 Beta-spectrum measured in the MED was used to predict this component in the LED background. The LED background below 150 keV is only slightly affected by exposure to the SAA.
[Figure 5] [Figure 6] [Figure 7]
Figure 5:
LE detector background
Figure 6:
ME detector background
Figure 7:
HE detector background

Detector gains required ~ 2 weeks to stabilize in orbit. This was expected because a PMTs gain is usually a function of its anode current history. Gain stability is determined using the light pulser spectral data shown in Figures 6 and 7. The light pulsers have an intrinsic FWHM of ~ 5% and the centroid of their spectral peak can be measured to < l% accuracy in ~ 5% min. The MED light pulser has a measured FWH of ~ 5%, indicating that the gain was stable to < 1% during the 90-minute integration. However, the HED light pulser is broadened to ~ 12%, due to ±4% gain variations. These are a result of systematic anode current changes due to orbital variation of geomagnetic cutoff of cosmic rays which interact in the HED. High energy-resolution scientific analysis with the HED will require gain corrections each ~ 10 minutes using the light pulser data. Data indicating LED short term gain stability are being analyzed at this time. In-orbit energy resolution cannot be measured accurately until the data are corrected for gain variations. All detectors' gains have been measured to be stable to ~ 1% over a period of one month.

[Figure 8]
Figure 8:
HE detector background rejection
The effect of the shield anticoincidence is measured by the RPHA which uses the shield antcoincidence signal for spectrum segment addressing while analyzing all NaI(Tl) events. The result for the HED is shown in Figure 8. The spectrum with the shield in anticoincidence is equivalent to the Figure 7 spectrum taken 10 hours after the SAA. Less detector radioactivity is indicated in Figure 8 since these data were taken earlier in the mission. The spectrum with the shield is coincidence is that of the detector energy losses which the shield normally rejects. At a11 energies shield rejection is significant. At the lowest energies where the aperture component is significant shield rejection is relatively small. However, at 7 MeV 99% of the energy losses are rejected. Internal radioactivity spectral lines, are weak in the coincidence spectrum, but the 511 keV line is prominent. This line results from the annihilation of positions which are produced and energy-degraded by mechanisms that trigger the shield.

Up to factor 5 background increases which last less than 0.64 s were discovered in the LEDs. They are apparently a result of long lived phosphorescence following large energy losses by cosmic-rays. These effects have been seen in balloon carried scintillators4,5. Raising the threshold to 14 keV rendered them negligible. Similar background increase occur in the GRBP. Since they cannot be reduced by changing threshold, the GRBP, was commanded to a mode where it triggers on the increases and then fills its memory with ~ 0.2 s time resolution. The result is that the GRBP is sensitive to gamma-ray bursts ~ 70% of the time.

V. Sensitivity

The instrument's sensitivity as a function of energy may be estimated using a knowledge of the detectors background spectra, efficiency and aperture geometry, and assuming an observation time2. The 3-sigma sensitivity is that cosmic flux, fmin (photon/cm2/s/keV), which would produce a detector counting rate equal to a three standard deviation background increase. It is given by:
3F/n(E) SQRT(B(E)*16pi/A*DeltaE*Omega*T)
where F corrects for off-axis source sightings, n(E) = detector efficiency, B(E) = detector background (count/cm2/s/keV), A = detector area (cm2) delta-E = energy band (keV), Omega= detector aperture solid angle (steradian), and T = the total time (s) of useful sky-scanning data. The sensitivity calculated for 6 months of operation with half the time lost to earth occultations and SAA encounters is given in Table 4. A comparison with the flux of the Crab Nebula, one of the most intense x- and gamma ray sources, is included. Up to ~ 200 keV sources as weak as 10-2 of the Crab Nebula will be detected with enough sensitivity to allow model spectra fitting. At higher energies the sensitivity is degraded by the various induced radioactivity components in the background. As a result sources weaker than the Crab Nebula will be difficult to detect above ~ 1 MeV. Careful selection of energy bands to avoid the larger background features, especially at ~ 200 and ~ 650 keV, will result in improved sensitivity.

Table 4: Sensitivity in Several Energy Bands
Detectors Energy
Band (keV)
Fminb
(photon/cm²/s/keV)
Fractionof
Crab Nebula
2 LEDs 15 -30
80 - 160
9.8x10⁻⁵
1.8x10⁻⁵
0.007
0.05
4 MEDs 80 - 160
500 - 1000
8.3x10⁻⁶
7.0x10⁻⁶
0.02
1.0
1 HED 500 - 1000
5000 - 10000
2.5x10⁻⁶
1.3x10⁻⁷
0.3
2.0

VI. Acknowledgments

Many people have made significant contributions to the development of the instrument. L. Peterson is the Principal Investigator. The instrument design and testing were done at UCSD or under UCSD management. R. Farnsworth was the program manager. M Chapman was the lead engineer. Significant input to the design and testing was provided by D. Gruber, R. Jerde, F. Knight, P. Nolan, and M. Pelling of UCSD. and A. ScheepMaker of MIT. The instrument checkout system was designed and built by E. Stephan and C. James, and software development for it was done by G. Huszar and R. Pegg, all of UCSD. The Instrument's electronics were designed, fabricated and tested by the Time-Zero Laboratories of the Ball Brothers Research Corporation. The Gamma-Ray Burst Processor was designed and tested at the Goddard Space Flight Center by R. Baker and F. Link, under the direction of R. Van Allen. Analysis of the experiment data will be shared by UCSD and MIT, where W. Lewin is Co-Principal Investigator. This work was supported by NASA Contract NAS 8-27974.

References

  1. J. L. Matteson, R.M. Pelling, and L. E. Peterson, in "The Context and Status of Gamma-Ray Astronomy," Proceedings of North EslabSymposium, 10-12 June 1974, Frascati, Italy, ed. B.G. Taylor, ESr0 SP-106, 177 (1974).
  2. L.E. Peterson, Ann. Rev. Astron. Ap.,13, 423 (1975).
  3. W. Forman, C. Jones, L . Continsky, P. Julien, S. Murray, . Peters, H. Tananbaum, and R. Giacconi, "The Fourth Uhuru Catalog of X-Ray Sources, " Ap J Supp 38, 357 (1978).
  4. G. Fishman and R. Austin, Nucl. Instr and Meth., 107, 193 (1976).
  5. Hurley, K., C.E.S.R. Report N0. 77-738 (1977).

HEAO A4 WWW page (at CASS, UCSD)
High Energy Astrophysics at CASS
HEAO 1 mission information (at the HEASARC, GSFC)