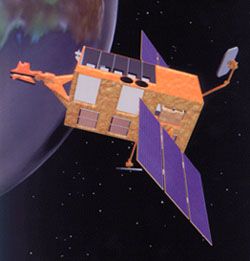


RXTE was used for sustained long-term X-ray monitoring of sources -- over 5-10 years in many cases. RXTE's two co-aligned instruments, the Proportional Counter Array (PCA; 2-60 keV) and the High-Energy X-ray Timing Experiment (HEXTE; 15-250 keV), provided simultaneous broadband X-ray coverage from 2 to >100 keV for the brightest AGN.
For each object, we provide 2-10 keV ASCII-format flux light curves from PCA data, with one point per observation. For objects with sufficient flux, we also include light curves for the sub-bands 2-4, 4-7 and 7-10 keV. For selected bright blazars, we include light curves of photon index Γ, obtained from model fits to 3-15 keV PCA spectra while accounting for absorption by the Galactic column.
We also provide time-averaged (summed) PCA spectral files, plus HEXTE spectral files for sufficiently bright sources. For results of fits to the time-averaged PCA (+HEXTE) spectra, please refer to E. Rivers, A. Markowitz, and R. Rothschild, "Full Spectral Survey of Active Galactic Nuclei in the Rossi X-Ray Timing Explorer Archive," Rivers et al. 2013, ApJ, 772, 114 or E. Rivers, A. Markowitz, and R. Rothschild, "Spectral Survey of X-Ray Bright Active Galactic Nuclei from the Rossi X-Ray Timing Explorer", 2011, ApJS, 193, 3. Here, we list average model fit parameters for each object, along with long-term average 2-10 keV fluxes from PCA data, plus 20-100 keV fluxes from HEXTE for sufficiently bright sources.
Note: Click on one of the headings to re-order the list according to that category.
| Source Name(s) | Type | R.A. & Decl. (J2000) | Redshift | # Good ObsIDs | MJD(1)− MJD(N) |
LINKS | |||||||||||||||||||||||||||||||||||||||||||||||||||||||||||||||
|---|---|---|---|---|---|---|---|---|---|---|---|---|---|---|---|---|---|---|---|---|---|---|---|---|---|---|---|---|---|---|---|---|---|---|---|---|---|---|---|---|---|---|---|---|---|---|---|---|---|---|---|---|---|---|---|---|---|---|---|---|---|---|---|---|---|---|---|---|---|
| Mkn 335 | NLSy1 | 00 06 19.52, +20 12 10.5 |
0.0258 | 191 | 51661.95− 55559.31 |
LIGHT CURVES & SPECTRA | |||||||||||||||||||||||||||||||||||||||||||||||||||||||||||||||
| RHS 03 (RBS 78) |
Sy1 | 00 34 16.7, −79 05 20 |
0.0740 | 1 | 50328.63− 50328.78 |
LIGHT CURVES & SPECTRA | |||||||||||||||||||||||||||||||||||||||||||||||||||||||||||||||
| Mkn 348 | Sy2 | 00 48 47.14, +31 57 25.1 |
0.0150 | 308 | 50227.60− 55920.54 |
LIGHT CURVES & SPECTRA | |||||||||||||||||||||||||||||||||||||||||||||||||||||||||||||||
| IRAS F00521−7054 | Sy2 | 00 53 56.1, −70 38 04 |
0.0689 | 2 | 50473.64− 50482.50 |
LIGHT CURVES & SPECTRA | |||||||||||||||||||||||||||||||||||||||||||||||||||||||||||||||
| PG 0052+251 | Sy1.2 | 00 54 52.10, +25 25 38.0 |
0.1545 | 153 | 50689.64− 53432.75 |
LIGHT CURVES & SPECTRA | |||||||||||||||||||||||||||||||||||||||||||||||||||||||||||||||
| TONS180 | NLSy1 | 00 57 19.94, −22 22 59.1 |
0.0620 | 416 | 51301.25− 51607.23 |
LIGHT CURVES & SPECTRA | |||||||||||||||||||||||||||||||||||||||||||||||||||||||||||||||
| Fairall 9 | Sy1 | 01 23 45.78, −58 48 20.8 |
0.0470 | 707 | 50390.61− 52699.51 |
LIGHT CURVES & SPECTRA | |||||||||||||||||||||||||||||||||||||||||||||||||||||||||||||||
| NGC 526A | Sy1.9/NELG | 01 23 54.39, −35 03 55.9 |
0.0191 | 22 | 52059.99− 52812.48 |
LIGHT CURVES & SPECTRA | |||||||||||||||||||||||||||||||||||||||||||||||||||||||||||||||
| RGB J0152+017 (RBS 248, BZB J0152+0147) |
BL Lac | 01 52 39.6, +01 47 17 |
0.0800 | 23 | 54417.91− 54450.26 |
LIGHT CURVES & SPECTRA | |||||||||||||||||||||||||||||||||||||||||||||||||||||||||||||||
| Mkn 590 | Sy1.2 | 02 14 33.56, +00 46 00.1 |
0.0264 | 37 | 51684.43− 51975.07 |
LIGHT CURVES & SPECTRA | |||||||||||||||||||||||||||||||||||||||||||||||||||||||||||||||
| 3C 66A (BZB J0222+4302) |
BL Lac | 02 22 39.61, +43 02 07.8 |
0.4440 | 58 | 52901.43− 53000.26 |
LIGHT CURVES & SPECTRA | |||||||||||||||||||||||||||||||||||||||||||||||||||||||||||||||
| 1ES 0229+200 | BL Lac | 02 32 48.62, +20 17 17.5 |
0.1400 | 205 | 55197.85− 55926.36 |
LIGHT CURVES & SPECTRA | |||||||||||||||||||||||||||||||||||||||||||||||||||||||||||||||
| NGC 1052 | Sy2/Radio | 02 41 04.80, −08 15 20.8 |
0.0050 | 148 | 53527.11− 55192.48 |
LIGHT CURVES & SPECTRA | |||||||||||||||||||||||||||||||||||||||||||||||||||||||||||||||
| NGC 1068 | Sy2/C-thick | 02 42 40.71, −00 00 47.8 |
0.0038 | 6 | 50311.78− 50313.95 |
LIGHT CURVES & SPECTRA | |||||||||||||||||||||||||||||||||||||||||||||||||||||||||||||||
| 4U 0241+61 | Sy1.2 | 02 44 57.70, +62 28 06.5 |
0.0440 | 18 | 50733.62− 50765.42 |
LIGHT CURVES & SPECTRA | |||||||||||||||||||||||||||||||||||||||||||||||||||||||||||||||
| RHS 17 | Sy1 | 03 00 08.0, +16 30 14 |
0.0350 | 2 | 50159.28− 50160.36 |
LIGHT CURVES & SPECTRA | |||||||||||||||||||||||||||||||||||||||||||||||||||||||||||||||
| 1H 0323+342 (RGB J0324+341) |
FSRQ | 03 24 41.16, +34 10 45.9 |
0.0610 | 37 | 55564.47− 55672.07 |
LIGHT CURVES & SPECTRA | |||||||||||||||||||||||||||||||||||||||||||||||||||||||||||||||
| PKS 0332−403 (BZB J0334−4008) |
FSRQ | 03 34 13.6, −40 08 25 |
1.4450 | 4 | 55320.18− 55355.17 |
LIGHT CURVES & SPECTRA | |||||||||||||||||||||||||||||||||||||||||||||||||||||||||||||||
| NGC 1386 (IRAS F03348−3609) |
Sy2 | 03 36 46.2, −35 59 58 |
0.0029 | 2 | 50739.97− 50746.84 |
LIGHT CURVES & SPECTRA | |||||||||||||||||||||||||||||||||||||||||||||||||||||||||||||||
| 1ES 0414+009 | BL Lac | 04 16 52.49, +01 05 23.9 |
0.2870 | 13 | 50146.25− 55600.21 |
LIGHT CURVES & SPECTRA | |||||||||||||||||||||||||||||||||||||||||||||||||||||||||||||||
| 3C 111 | BLRG/Sy1 | 04 18 21.28, +38 01 35.8 |
0.0485 | 1004 | 50529.14− 55924.41 |
LIGHT CURVES & SPECTRA | |||||||||||||||||||||||||||||||||||||||||||||||||||||||||||||||
| 3C 120 | BLRG/Sy1 | 04 33 11.10, +05 21 15.6 |
0.0330 | 1335 | 50153.18− 54221.88 |
LIGHT CURVES & SPECTRA | |||||||||||||||||||||||||||||||||||||||||||||||||||||||||||||||
| IRAS F04385−0828 | Sy2 | 04 40 54.9, −08 22 22 |
0.0151 | 2 | 50572.29− 50579.25 |
LIGHT CURVES & SPECTRA | |||||||||||||||||||||||||||||||||||||||||||||||||||||||||||||||
| IRAS 04575−7537 (ESO 33-G2) |
Sy2 | 04 55 58.96, −75 32 28.2 |
0.0181 | 12 | 50427.77− 50648.97 |
LIGHT CURVES & SPECTRA | |||||||||||||||||||||||||||||||||||||||||||||||||||||||||||||||
| Ark 120 | Sy1 | 05 16 11.42, −00 08 59.4 |
0.0327 | 197 | 50868.09− 52876.74 |
LIGHT CURVES & SPECTRA | |||||||||||||||||||||||||||||||||||||||||||||||||||||||||||||||
| Pictor A | Sy1/LINER | 05 19 49.72, −45 46 43.8 |
0.0351 | 5 | 50576.18− 50579.47 |
LIGHT CURVES & SPECTRA | |||||||||||||||||||||||||||||||||||||||||||||||||||||||||||||||
| IRAS F05189−2524 | Sy2/ULIRG | 05 21 01.4, −25 21 45 |
0.0426 | 2 | 50731.04− 50739.83 |
LIGHT CURVES & SPECTRA | |||||||||||||||||||||||||||||||||||||||||||||||||||||||||||||||
| E253−G3 | Sy2 | 05 25 18.1, −46 00 21 |
0.0425 | 2 | 50572.13− 50579.28 |
LIGHT CURVES & SPECTRA | |||||||||||||||||||||||||||||||||||||||||||||||||||||||||||||||
| PKS 0528+134 | FSRQ | 05 30 40.56, +13 31 55.1 |
2.0600 | 99 | 50311.09− 55194.65 |
LIGHT CURVES & SPECTRA | |||||||||||||||||||||||||||||||||||||||||||||||||||||||||||||||
| PKS 0537−441 (BZB J0538−4405) |
BL Lac | 05 38 50.3, −44 05 09 |
0.8940 | 3 | 55351.00− 55354.13 |
LIGHT CURVES & SPECTRA | |||||||||||||||||||||||||||||||||||||||||||||||||||||||||||||||
| PKS 0537−286 (BZB J0539−2839) |
QSO | 05 39 54.3, −28 39 56 |
3.1040 | 24 | 54036.02− 54041.97 |
LIGHT CURVES & SPECTRA | |||||||||||||||||||||||||||||||||||||||||||||||||||||||||||||||
| PKS 0548−322 | BL Lac | 05 50 40.56, −32 16 17.1 |
0.0690 | 6 | 51908.57− 51912.67 |
LIGHT CURVES & SPECTRA | |||||||||||||||||||||||||||||||||||||||||||||||||||||||||||||||
| NGC 2110 | Sy2/C-thick | 05 52 11.38, −07 27 22.4 |
0.0078 | 27 | 50789.64− 52704.31 |
LIGHT CURVES & SPECTRA | |||||||||||||||||||||||||||||||||||||||||||||||||||||||||||||||
| MCG+8-11-11 | Sy1 | 05 54 53.61, +46 26 21.6 |
0.0205 | 1 | 50104.34− 50104.38 |
LIGHT CURVES & SPECTRA | |||||||||||||||||||||||||||||||||||||||||||||||||||||||||||||||
| PKS 0558−504 | NLSy1 | 05 59 47.38, −50 26 52.4 |
0.1372 | 1012 | 50734.45− 55923.16 |
LIGHT CURVES & SPECTRA | |||||||||||||||||||||||||||||||||||||||||||||||||||||||||||||||
| Mkn 3 | Sy2 | 06 15 36.36, +71 02 15.1 |
0.0135 | 12 | 50442.71− 50635.09 |
LIGHT CURVES & SPECTRA | |||||||||||||||||||||||||||||||||||||||||||||||||||||||||||||||
| 1ES 0647+250 | BL Lac | 06 50 46.49, +25 02 59.6 |
0.2030 | 20 | 55506.67− 55620.92 |
LIGHT CURVES & SPECTRA | |||||||||||||||||||||||||||||||||||||||||||||||||||||||||||||||
| 1H 0707−495 | NLSy1 | 07 08 41.5, −49 33 07 |
0.0406 | 5 | 50521.15− 50522.40 |
LIGHT CURVES & SPECTRA | |||||||||||||||||||||||||||||||||||||||||||||||||||||||||||||||
| RGB J0710+591 | BL Lac | 07 10 30.07, +59 08 20.4 |
0.1250 | 11 | 55562.32− 55627.18 |
LIGHT CURVES & SPECTRA | |||||||||||||||||||||||||||||||||||||||||||||||||||||||||||||||
| S5 0716+714 | BL Lac | 07 21 53.45, +71 20 36.4 |
0.3000 | 231 | 50179.64− 55558.40 |
LIGHT CURVES & SPECTRA | |||||||||||||||||||||||||||||||||||||||||||||||||||||||||||||||
| Mkn 79 (UGC 3973) |
Sy1.2 | 07 42 32.80, +49 48 34.7 |
0.0222 | 1646 | 51610.57− 55925.58 |
LIGHT CURVES & SPECTRA | |||||||||||||||||||||||||||||||||||||||||||||||||||||||||||||||
| 1ES 0806+524 (RBS 692, BZB J0809+5218) |
BL Lac | 08 09 49.2, +52 18 58 |
0.1380 | 20 | 50488.25− 54538.35 |
LIGHT CURVES & SPECTRA | |||||||||||||||||||||||||||||||||||||||||||||||||||||||||||||||
| PG 0804+761 | Sy1 | 08 10 58.60, +76 02 42.5 |
0.1000 | 264 | 51202.53− 53362.83 |
LIGHT CURVES & SPECTRA | |||||||||||||||||||||||||||||||||||||||||||||||||||||||||||||||
| PKS 0829+046 (CRATES J0831+0429) |
FSRQ | 08 31 48.88, +04 29 39.1 |
0.1737 | 87 | 54870.48− 55195.63 |
LIGHT CURVES & SPECTRA | |||||||||||||||||||||||||||||||||||||||||||||||||||||||||||||||
| 4C 71.07 (CRATES J0841+7053) |
FSRQ | 08 41 24.37, +70 53 42.2 |
2.1720 | 207 | 54869.06− 55558.34 |
LIGHT CURVES & SPECTRA | |||||||||||||||||||||||||||||||||||||||||||||||||||||||||||||||
| PKS 0921−213 | FSRQ/Sy1 | 09 23 38.89, −21 35 47.1 |
0.0520 | 14 | 53422.53− 53427.09 |
LIGHT CURVES & SPECTRA | |||||||||||||||||||||||||||||||||||||||||||||||||||||||||||||||
| Mkn 110 | NLSy1.5 | 09 25 12.87, +52 17 10.5 |
0.0353 | 1432 | 51610.56− 55925.59 |
LIGHT CURVES & SPECTRA | |||||||||||||||||||||||||||||||||||||||||||||||||||||||||||||||
| NGC 2992 | Sy2 | 09 45 42.05, −14 19 35.0 |
0.0077 | 24 | 53433.58− 53763.43 |
LIGHT CURVES & SPECTRA | |||||||||||||||||||||||||||||||||||||||||||||||||||||||||||||||
| MCG−5-23-16 | Sy2/NELG | 09 47 40.16, −30 56 55.4 |
0.0085 | 18 | 50197.27− 53713.83 |
LIGHT CURVES & SPECTRA | |||||||||||||||||||||||||||||||||||||||||||||||||||||||||||||||
| NGC 3227 | Sy1.5 | 10 23 30.58, +19 51 54.2 |
0.0039 | 1078 | 50405.83− 53708.99 |
LIGHT CURVES & SPECTRA | |||||||||||||||||||||||||||||||||||||||||||||||||||||||||||||||
| NGC 3281 (IRAS F10295−3435) |
Sy2 | 10 31 52.1, −34 51 13 |
0.0110 | 6 | 53405.98− 53406.42 |
LIGHT CURVES & SPECTRA | |||||||||||||||||||||||||||||||||||||||||||||||||||||||||||||||
| 1ES 1101−232 | BL Lac | 11 03 37.61, −23 29 31.2 |
0.1860 | 99 | 53434.90− 55443.06 |
LIGHT CURVES & SPECTRA | |||||||||||||||||||||||||||||||||||||||||||||||||||||||||||||||
| Mkn 421 (BZB J1104+3812) |
BL Lac | 11 04 27.31, +38 13 31.8 |
0.0300 | 1182 | 50143.27− 55926.50 |
LIGHT CURVES & SPECTRA | |||||||||||||||||||||||||||||||||||||||||||||||||||||||||||||||
| NGC 3516 | Sy1.5 | 11 06 47.49, +72 34 06.9 |
0.0088 | 628 | 50523.01− 55925.39 |
LIGHT CURVES & SPECTRA | |||||||||||||||||||||||||||||||||||||||||||||||||||||||||||||||
| PG 1116+215 | Sy1/QSO | 11 19 08.7, +21 19 18 |
0.1765 | 5 | 50286.13− 50293.37 |
LIGHT CURVES & SPECTRA | |||||||||||||||||||||||||||||||||||||||||||||||||||||||||||||||
| Mkn 180 (CRATES J1136+7009) |
BL Lac | 11 36 26.41, 70 09 27.3 |
0.0453 | 13 | 50488.21− 51638.02 |
LIGHT CURVES & SPECTRA | |||||||||||||||||||||||||||||||||||||||||||||||||||||||||||||||
| NGC 3783 | Sy1 | 11 39 01.76, −37 44 19.2 |
0.0097 | 1719 | 50112.86− 55928.38 |
LIGHT CURVES & SPECTRA | |||||||||||||||||||||||||||||||||||||||||||||||||||||||||||||||
| NGC 3998 | Sy1 | 11 57 56.13, +55 27 12.9 |
0.0035 | 371 | 55561.62− 55921.21 |
LIGHT CURVES & SPECTRA | |||||||||||||||||||||||||||||||||||||||||||||||||||||||||||||||
| 4C 29.45 (TXS 1156+295, CRATES J1159+2914) |
FSRQ | 11 59 31.83, +29 14 43.8 |
0.7247 | 45 | 50892.39− 55306.46 |
LIGHT CURVES & SPECTRA | |||||||||||||||||||||||||||||||||||||||||||||||||||||||||||||||
| NGC 4051 | NLSy1.5 | 12 03 09.61, +44 31 52.8 |
0.0023 | 2125 | 50196.49− 55925.45 |
LIGHT CURVES & SPECTRA | |||||||||||||||||||||||||||||||||||||||||||||||||||||||||||||||
| PG 1202+281 | Sy1 | 12 04 42.11, +27 54 11.8 |
0.1653 | 6 | 50725.22− 50730.15 |
LIGHT CURVES & SPECTRA | |||||||||||||||||||||||||||||||||||||||||||||||||||||||||||||||
| NGC 4151 | Sy1.5 | 12 10 32.58, +39 24 20.6 |
0.0033 | 509 | 50102.91− 53157.07 |
LIGHT CURVES & SPECTRA | |||||||||||||||||||||||||||||||||||||||||||||||||||||||||||||||
| PG 1211+143 | NLSy1 | 12 14 17.66, +14 03 13.3 |
0.0809 | 42 | 50676.12− 50999.67 |
LIGHT CURVES & SPECTRA | |||||||||||||||||||||||||||||||||||||||||||||||||||||||||||||||
| Mkn 766 (NGC 4253) |
NLSy1 | 12 18 26.51, +29 48 46.3 |
0.0129 | 768 | 52034.44− 55924.11 |
LIGHT CURVES & SPECTRA | |||||||||||||||||||||||||||||||||||||||||||||||||||||||||||||||
| NGC 4258 (M106) |
Sy2/LINER | 12 18 57.50, +47 18 14.3 |
0.0015 | 1243 | 50420.70− 55924.13 |
LIGHT CURVES & SPECTRA | |||||||||||||||||||||||||||||||||||||||||||||||||||||||||||||||
| 1ES 1218+304 | BL Lac | 12 21 21.94, +30 10 37.1 |
0.1836 | 9 | 50593.74− 50597.67 |
LIGHT CURVES & SPECTRA | |||||||||||||||||||||||||||||||||||||||||||||||||||||||||||||||
| NGC 4388 | Sy2/C-thick | 12 25 46.75, +12 39 43.5 |
0.0084 | 12 | 50148.71− 52769.42 |
LIGHT CURVES & SPECTRA | |||||||||||||||||||||||||||||||||||||||||||||||||||||||||||||||
| 3C 273 (PG 1226+023) |
FSRQ | 12 29 06.70, +02 03 08.6 |
0.1583 | 1960 | 50115.06− 55926.56 |
LIGHT CURVES & SPECTRA | |||||||||||||||||||||||||||||||||||||||||||||||||||||||||||||||
| TON1542 (Mkn 771, Ark 374, RBS 1125) |
Sy1 | 12 32 03.6, +20 09 29 |
0.0630 | 9 | 50299.11− 50304.53 |
LIGHT CURVES & SPECTRA | |||||||||||||||||||||||||||||||||||||||||||||||||||||||||||||||
| NGC 4507 | Sy2 | 12 35 36.63, −39 54 33.3 |
0.0118 | 16 | 50137.50− 52816.18 |
LIGHT CURVES & SPECTRA | |||||||||||||||||||||||||||||||||||||||||||||||||||||||||||||||
| NGC 4593 | Sy1 | 12 39 39.43, −05 20 39.3 |
0.0090 | 1329 | 52089.04− 55926.57 |
LIGHT CURVES & SPECTRA | |||||||||||||||||||||||||||||||||||||||||||||||||||||||||||||||
| 3C 279 | FSRQ | 12 56 11.1, −05 47 22 |
0.5362 | 1987 | 50104.63− 55925.99 |
LIGHT CURVES & SPECTRA | |||||||||||||||||||||||||||||||||||||||||||||||||||||||||||||||
| NGC 4945 | Sy2/C-thick | 13 05 27.48, −49 28 05.6 |
0.0019 | 533 | 50729.53− 54193.57 |
LIGHT CURVES & SPECTRA | |||||||||||||||||||||||||||||||||||||||||||||||||||||||||||||||
| Centaurus A (NGC 5128) |
NLRG | 13 25 27.62, −43 01 08.8 |
0.0018 | 455 | 50309.23− 55921.69 |
LIGHT CURVES & SPECTRA | |||||||||||||||||||||||||||||||||||||||||||||||||||||||||||||||
| MCG−6-30-15 | NLSy1.2 | 13 35 53.71, −34 17 43.9 |
0.0077 | 1555 | 50159.77− 55559.80 |
LIGHT CURVES & SPECTRA | |||||||||||||||||||||||||||||||||||||||||||||||||||||||||||||||
| IRAS 13349+2438 | Sy1/NLSy1 | 13 37 18.73, +24 23 03.4 |
0.1076 | 4 | 50771.96− 50772.81 |
LIGHT CURVES & SPECTRA | |||||||||||||||||||||||||||||||||||||||||||||||||||||||||||||||
| IC 4329A | Sy1.2 | 13 49 19.27, −30 18 34.0 |
0.0161 | 581 | 50298.84− 54319.25 |
LIGHT CURVES & SPECTRA | |||||||||||||||||||||||||||||||||||||||||||||||||||||||||||||||
| Mkn 279 | Sy1.5 | 13 53 03.4, +69 18 30 |
0.0305 | 63 | 50225.03− 52418.04 |
LIGHT CURVES & SPECTRA | |||||||||||||||||||||||||||||||||||||||||||||||||||||||||||||||
| Circinus | Sy2/C-thick | 14 13 09.95, −65 20 21.2 |
0.0014 | 19 | 51098.16− 51711.71 |
LIGHT CURVES & SPECTRA | |||||||||||||||||||||||||||||||||||||||||||||||||||||||||||||||
| NGC 5506 | Sy1.9 | 14 13 14.89, −03 12 27.3 |
0.0062 | 651 | 50159.82− 53225.13 |
LIGHT CURVES & SPECTRA | |||||||||||||||||||||||||||||||||||||||||||||||||||||||||||||||
| NGC 5548 | Sy1.5 | 14 17 59.52, +25 08 12.4 |
0.0172 | 1015 | 50208.04− 55925.52 |
LIGHT CURVES & SPECTRA | |||||||||||||||||||||||||||||||||||||||||||||||||||||||||||||||
| PG 1416−129 | Sy1/QSO | 14 19 03.8, −13 10 44 |
0.0791 | 3 | 51046.35− 51048.19 |
LIGHT CURVES & SPECTRA | |||||||||||||||||||||||||||||||||||||||||||||||||||||||||||||||
| H 1426+428 | BL Lac | 14 28 32.66, +42 40 20.6 |
0.1291 | 169 | 51664.96− 53223.76 |
LIGHT CURVES & SPECTRA | |||||||||||||||||||||||||||||||||||||||||||||||||||||||||||||||
| PG 1440+356 (Mkn 478) |
NLSy1 | 14 42 07.4, +35 26 23 |
0.0791 | 9 | 50676.22− 50681.24 |
LIGHT CURVES & SPECTRA | |||||||||||||||||||||||||||||||||||||||||||||||||||||||||||||||
| PKS 1510−089 | FSRQ | 15 12 50.53, −09 05 59.8 |
0.3600 | 1317 | 50430.66− 55926.01 |
LIGHT CURVES & SPECTRA | |||||||||||||||||||||||||||||||||||||||||||||||||||||||||||||||
| RHS 53 (RBS 1524) |
BL Lac | 15 40 15.8, +81 55 06 |
??? | 1 | 50156.05− 50156.21 |
LIGHT CURVES & SPECTRA | |||||||||||||||||||||||||||||||||||||||||||||||||||||||||||||||
| MCG−2-40-4 | Sy2 | 15 48 24.95, −13 45 28.0 |
0.0252 | 2 | 50712.39− 50718.74 |
LIGHT CURVES & SPECTRA
| PG 1553+113 (CRATES J1555+1111) |
FSRQ |
15 55 43.04, |
+11 11 24.4 0.3600 |
48 |
50503.03− |
52771.90 LIGHT CURVES & SPECTRA |
PKS B1622−297 |
FSRQ |
16 26 06.0, |
−29 51 27.0 0.8150 |
79 |
50678.19− |
53943.18 LIGHT CURVES & SPECTRA |
NGC 6251 |
Sy2 |
16 32 32.0, |
+82 32 16 0.0247 |
95 |
53433.18− |
53793.18 LIGHT CURVES & SPECTRA |
NGC 6240 |
Sy2/C-thick |
16 52 58.87, |
+02 24 03.3 0.0245 |
18 |
50761.63− |
53405.70 LIGHT CURVES & SPECTRA |
Mkn 501 |
(CRATES J1653+3945) BL Lac |
16 53 52.22, |
+39 45 36.6 0.0337 |
496 |
50296.57− |
55922.10 LIGHT CURVES & SPECTRA |
NGC 6300 |
Sy2 |
17 16 59.47, |
−62 49 14.0 0.0037 |
3 |
50499.32− |
50499.86 LIGHT CURVES & SPECTRA |
1ES 1727+502 |
(I Zw 187) BL Lac |
17 28 18.62, |
+50 13 10.5 0.0554 |
17 |
50368.81− |
51694.12 LIGHT CURVES & SPECTRA |
PDS 456 |
Sy1/QSO |
17 28 19.80, |
−14 15 55.9 0.1840 |
137 |
50879.87− |
55016.37 LIGHT CURVES & SPECTRA |
NRAO 530 |
FSRQ |
17 33 02.71, |
−13 04 49.5 0.9020 |
72 |
54903.59− |
55151.11 LIGHT CURVES & SPECTRA |
| 1ES 1741+196 | BL Lac | 17 43 57.83, +19 35 09.0 |
0.0840 | 14 | 51696.03− 51700.15 |
LIGHT CURVES & SPECTRA |
| 3C 382 | BLRG/Sy1 | 18 35 03.39, +32 41 46.8 |
0.0579 | 23 | 50536.03− 53309.18 |
LIGHT CURVES & SPECTRA | |||||||||||||||||||||||||||||||||||||||||||||||||||||||||||||||
| IRAS 18325−5926 (Fairall 49) |
Sy2 | 18 36 58.28, −59 24 08.6 |
0.0200 | 24 | 50113.95− 50868.28 |
LIGHT CURVES & SPECTRA | |||||||||||||||||||||||||||||||||||||||||||||||||||||||||||||||
| ESO 103−G35 (IRAS F18333−6528) |
Sy2/Radio | 18 38 20.34, −65 25 39.2 |
0.0133 | 15 | 50549.86− 50766.62 |
LIGHT CURVES & SPECTRA | |||||||||||||||||||||||||||||||||||||||||||||||||||||||||||||||
| 3C 390.3 | BLRG/Sy1 | 18 42 08.99, +79 46 17 |
0.0561 | 332 | 50220.61− 53384.02 |
LIGHT CURVES & SPECTRA | |||||||||||||||||||||||||||||||||||||||||||||||||||||||||||||||
| Cygnus A (3C 405) |
Sy2/Radio | 19 59 28.36, +40 44 02.1 |
0.0561 | 16 | 50183.95− 51691.78 |
LIGHT CURVES & SPECTRA | |||||||||||||||||||||||||||||||||||||||||||||||||||||||||||||||
| 1ES 1959+650 | BL Lac | 19 59 59.8, +65 08 55 |
0.0470 | 147 | 51753.92− 55862.14 |
LIGHT CURVES & SPECTRA | |||||||||||||||||||||||||||||||||||||||||||||||||||||||||||||||
| PKS 2005−489 | BL Lac | 20 09 25.39, −48 49 53.7 |
0.0710 | 158 | 50660.04− 55015.80 |
LIGHT CURVES & SPECTRA | |||||||||||||||||||||||||||||||||||||||||||||||||||||||||||||||
| RHS 56 (RBS 1688) |
NLSy1 | 20 39 27.2, −30 18 52 |
0.0791 | 1 | 50169.76− 50169.93 |
LIGHT CURVES & SPECTRA | |||||||||||||||||||||||||||||||||||||||||||||||||||||||||||||||
| Mkn 509 | Sy1.2 | 20 44 09.74, −10 43 24.6 |
0.0344 | 364 | 50204.14− 53945.82 |
LIGHT CURVES & SPECTRA | |||||||||||||||||||||||||||||||||||||||||||||||||||||||||||||||
| IC 5063 | Sy2 | 20 52 02.34, −57 04 07.6 |
0.0113 | 7 | 50410.99− 50437.07 |
LIGHT CURVES & SPECTRA | |||||||||||||||||||||||||||||||||||||||||||||||||||||||||||||||
| PKS 2126−158 | FSRQ | 21 29 12.18, −15 38 41.0 |
3.2680 | 4 | 50167.15− 51273.04 |
LIGHT CURVES & SPECTRA | |||||||||||||||||||||||||||||||||||||||||||||||||||||||||||||||
| PKS 2155−304 | BL Lac | 21 58 52.07, −30 13 32.1 |
0.1160 | 454 | 50219.03− 55364.76 |
LIGHT CURVES & SPECTRA | |||||||||||||||||||||||||||||||||||||||||||||||||||||||||||||||
| NGC 7172 | Sy2 | 22 02 01.89, −31 52 10.8 |
0.0087 | 10 | 50430.38− 50442.58 |
LIGHT CURVES & SPECTRA | |||||||||||||||||||||||||||||||||||||||||||||||||||||||||||||||
| BL Lac | BL Lac | 22 02 43.29, +42 16 40.0 |
0.0686 | 1384 | 50645.05− 55926.28 |
LIGHT CURVES & SPECTRA | |||||||||||||||||||||||||||||||||||||||||||||||||||||||||||||||
| NGC 7213 | Sy1.5/Radio | 22 09 16.31, −47 09 59.8 |
0.0058 | 819 | 53797.01− 55195.01 |
LIGHT CURVES & SPECTRA | |||||||||||||||||||||||||||||||||||||||||||||||||||||||||||||||
| CTA 102 (DA 582, RGB J2232+117) |
FSRQ | 22 32 36.41, +11 43 50.9 |
1.0370 | 43 | 51179.28− 53775.27 |
LIGHT CURVES & SPECTRA | |||||||||||||||||||||||||||||||||||||||||||||||||||||||||||||||
| NGC 7314 | Sy1.9 | 22 35 46.19, −26 03 01.7 |
0.0048 | 140 | 51179.75− 52477.71 |
LIGHT CURVES & SPECTRA | |||||||||||||||||||||||||||||||||||||||||||||||||||||||||||||||
| Ark 564 | NLSy1 | 22 42 39.35, +29 43 31.3 |
0.0247 | 569 | 50440.77− 52702.85 |
LIGHT CURVES & SPECTRA | |||||||||||||||||||||||||||||||||||||||||||||||||||||||||||||||
| 3C 454.3 | FSRQ | 22 53 57.75, +16 08 53.6 |
0.8590 | 59 | 53503.03− 53619.04 |
LIGHT CURVES & SPECTRA | |||||||||||||||||||||||||||||||||||||||||||||||||||||||||||||||
| MR 2251−178 | Sy1.5/QSO | 22 54 05.80, −17 34 55 |
0.0640 | 640 | 52034.44− 55924.11 |
LIGHT CURVES & SPECTRA | |||||||||||||||||||||||||||||||||||||||||||||||||||||||||||||||
| PKS 2255−282 (BZQ J2258−2758) |
FSRQ | 22 58 06.0, −27 58 21 |
0.9258 | 1 | 50828.04− 50828.14 |
LIGHT CURVES & SPECTRA | |||||||||||||||||||||||||||||||||||||||||||||||||||||||||||||||
| NGC 7469 | Sy1.2 | 23 03 15.62, +08 52 26.4 |
0.0163 | 818 | 50185.23− 55194.94 |
LIGHT CURVES & SPECTRA | |||||||||||||||||||||||||||||||||||||||||||||||||||||||||||||||
| MCG−2-58-22 (Mkn 926) |
Sy1.5 | 23 04 43.48, −08 41 08.6 |
0.0469 | 31 | 50798.12− 51487.43 |
LIGHT CURVES & SPECTRA | |||||||||||||||||||||||||||||||||||||||||||||||||||||||||||||||
| NGC 7582 | Sy2/C-thick | 23 18 23.50, −42 22 14.0 |
0.0053 | 23 | 52795.02− 53247.49 |
LIGHT CURVES & SPECTRA | |||||||||||||||||||||||||||||||||||||||||||||||||||||||||||||||
| RHS 61 (RBS 2005) |
Sy1 | 23 25 54.2, +21 53 14 |
0.1200 | 1 | 50202.07− 50202.30 |
LIGHT CURVES & SPECTRA | |||||||||||||||||||||||||||||||||||||||||||||||||||||||||||||||
| 1ES 2344+514 | BL Lac | 23 47 04.84, +51 42 17.9 |
0.0440 | 53 | 54380.27− 54476.16 |
LIGHT CURVES & SPECTRA | |||||||||||||||||||||||||||||||||||||||||||||||||||||||||||||||
| H 2356−309 (BZB J2359−3037) |
BL Lac | 23 59 07.9, −30 37 41 |
0.1654 | 2 | 53320.37− 53320.83 |
LIGHT CURVES & SPECTRA |
Data reduction details: PCA spectra were extracted for each observation using HEASOFT version 6.7 and the "rex" perl script. We extracted PCA STANDARD-2 data from PCUs 0, 1 and 2 prior to 1998 December 23; PCUs 0 and 2 from 1998 December 23 until 2000 May 12; and PCU 2 only after 2000 May 12. We used only events from the top Xe layer in order to maximize signal-to-noise. Standard screening was applied: data were rejected if taken with 20 minutes of the spacecraft's passing through the South Atlantic Anomaly (TIME_SINCE_SAA), if ELECTRON0 > 0.1 (ELECTRON2 for data after 2000 May 12), if the spacecraft was pointed within 10 degrees of the Earth, or if the source was > 0.02 degrees from the optical axis. All time-averaged spectral files were using the 2011 PCA background models "pca_bkgd_cmvle_eMv20111129.mdl" or "pca_bkgd_cmfaintl7_eMv20111129.mdl" for source fluxes brighter/fainter than ∼5 mCrab, respectively. HEXTE Science Event data used the same screening criteria as for the PCA.
The PCA response evolved gradually during the mission due to gas exchange between the propane layer and top-most Xenon layer. PCA responses were thus generated for each observation separately using PCARSP version 11.7.1. For the summed spectrum, the individual PCA responses were summed with weighting according to good exposure time. The PCA response file available for download for a given object is thus appropriate for that object only.
Light curves are in units of flux, with one data point per observation: fluxes/photon indices were obtained by spectral fitting for each observation. For the 2-10 keV light curves, we applied the best-fit time-averaged spectral model to each individual observation (exceptions: we fit a broken power-law model to the time-averaged spectra of 1ES 1101−232 and Mkn 501, but an unbroken power law provided good fits to their individual spectra). The spectral parameters that we kept free and the bandpass that we used are listed in the header of the 2-10 keV ASCII light curve. We usually kept photon index, power-law normalization, and the intensity of the Fe Kα emission line (if present in the time-averaged spectrum) free, while keeping all other parameters such as those for Compton reflection components or absorption components, or energy centroid and width of the Fe Kα line frozen at their time-averaged values unless otherwise stated. We fit over the bandpass 3.3 keV to 10, 18, or 23 keV, depending on the source's average X-ray brightness (2-10 keV flux typically >∼ 7×10⁻¹¹, ∼1.5 −∼7×10⁻¹¹, and <∼1.5×10⁻¹¹ erg cm−2 s−1, respectively, with flux boundaries ∼a third lower for heavily-absorbed type 2 sources). Sub-band light curves were generated via a simple power-law to that band only; we used the 2005 background files, and will reprocess them using the 2011 background models at some point in the future. Uncertainties on each flux point were obtained by dividing the standard deviation of the N 16-s binned count rate light curve points in that observation by sqrt(N). Uncertainties on photon index are at the 90% confidence level, corresponding to Δχ2=2.71. For three bright sources, we added systematics to obtain values of reduced χ2 near 1: 3%, 5% and 5% for NGC 5506, NGC 4151 and Cen A, respectively. Entries in the time column correspond to the mid-point of each observation after data screening.
The following sources were modeled by Rivers et al. (2013) with ionized absorption: IRAS 13349+2438, Mkn 766, NGC 3227, NGC 3516, NGC 3783, NGC 4051, NGC 4593, NGC 5548, PG 0804+761. For those sources, we include an XSTAR table as part of the spectral files available for download.
1. PCA light curve flux systematic uncertainties: Flux uncertainties in the ASCII light curves and the displayed light curve plots are statistical only. Additional systematic uncertainties up to ∼3-7×10⁻¹³ (2-10 keV), ∼2-4×10⁻¹³ (2-4 keV), ∼1-2×10⁻¹³ (4-7 keV), ∼1×10⁻¹³ (7-10 keV) erg cm−2 s−1 due to unmodeled variations in the X-ray background may be present, e.g., up to an additional 10% for a 2-10 keV flux of 7×10-12 erg cm−2 s−1; see K. Jahoda et al. 2006, ApJS, 163, 401 for further details.
2. Spectral fit systematic uncertainties: The listed uncertainties on model fit parameters are purely statistical. Systematic uncertainty associated due to unmodeled variations in the PCA or HEXTE X-ray background will present an additional contribution to the uncertainties on parameters for broad components (e.g., power-law photon index Γ), with the exact amount depending on the bandpass used. For example, consider the case of a relatively faint source with a PCA-only spectrum modeled by a simple power law over the 2-20 keV band. For a 2-10 keV flux of ∼9 × 10⁻¹² erg cm−2 s−1, one might expect additional systematic uncertainty on Γ of ∼0.10-0.15. For a 2-10 keV flux of ∼6 × 10⁻¹², additional uncertainty on Γ can be ∼0.15-0.25.
3. PCA flux limits: As per K. Jahoda et al. 2006, ApJS, 163, 401, the PCA is confusion-limited at a 2-10 keV flux of ∼4×10⁻¹² erg cm−2 s−1 (∼ 0.3 ct s−1 PCU−1). Spatial fluctiations in the Cosmic X-ray Background, on the order of 7% in 2-10 keV, cannot be predicted by the background model. These fluctuations set the limit below which fluxes cannot be determined by the PCA. For the following sources, we measured 2-10 keV fluxes fainter than ∼3 × 10⁻¹² erg cm−2 s−1 (see Appendix A of Rivers et al. 2013), and we thus exclude them from the above table: 0420−014 (OA 129), 3C 446 (1ES 2223−051), 4C 38.41 (1633+382, OS 356), Arp 220, H0147−537, IRAS F01475−0740, IRAS F03362−1642, IRAS F08572+3915, IRAS F19254−7245 (AM 1925−724), LBQS 2212−1759, MCG−3-34-63, NGC 1320, NGC 3660, NGC 5347, NGC 6394, NGC 6890, OJ 287, PG 1424+240 (OQ 240), PG 1700+518, PKS 0235+164, PKS 0348−120, PKS 0405−385, RHS 15, RHS 54, TOL 1238−364 (IC 3639), and W Com (RGB J1221+282).
4. HEXTE Considerations: Cluster Rocking, Evolution in Background: HEXTE consisted of two clusters, A and B, both of which gathered simultaneous background data by two-sided rocking to offset positions every 16 or 32 s. We do not combine Cluster A and B data. Detector 2 in Cluster B lost spectral capabilities in 1996 and we consider data from detectors 0, 1, and 3 only.
Cluster A did not rock on/off source during 2004 Dec 13 - 2005 Jan 14, 2005 Dec 12 - 2006 Jan 4, during 2006 Jan 25, and it stopped rocking permanently on 2006 Mar 14. Cluster B stopped rocking on 2009 Dec 14. (Please see the "RXTE Big Events" web page for additional details.) We do not consider data taken after these dates. Good exposure times for the summed HEXTE spectra will differ significantly between Cluster A and Cluster B if a given source was observed during 2006-2009.
Typical 20-100 keV background fluxes were 6-12×10−9 erg cm−2 s−1, and HEXTE background subtraction is well understood for source fluxes down to roughly 1% of the background (D. Gruber et al. 1996, A&AS, 120C, 621).
As a very rough guideline for analyzing binned HEXTE spectra: When the 20-100 keV net source flux is less than ∼7×10⁻¹¹ erg cm−2 s−1, the highest useable energy bin will be (very roughly) ∼ 120-150 keV, 80-100 keV, or 50 keV typically when the exposure time for one cluster is >∼250 ks, ∼50-250 ks, or <∼50 ks, respectively. The highest useable energy bin can be ∼150-240 keV only when the 20-100 keV flux is above ∼7×10⁻¹¹ erg cm−2 s−1, and/or if the good exposure time per cluster HEXTE is above a couple hundred ks.
The long-term average background flux has varied by a factor of ∼2 over the course of the RXTE mission due to variations in solar activity and the evolution of the satellite's altitude and thus the flux of intercepted particles; see Appendix B of Rivers et al. 2011 and also F. Fuerst et al. 2009, Earth Planet. Sci. Lett., 281, 125.
HEXTE exposure times have been corrected for dead-time (typically 30-40%) due to cluster rocking, pulse analyzer electronics, and recovery time following scintillation pulses caused by high energy particles. Exposure times for the summed spectra are typically less than half that of the summed PCA spectrum for a given object.
The summed HEXTE spectra for each of the 23 sources in Rivers et al. (2011) are detected at 3σ or better out to 100 keV; these sources have F20-100 greater than ∼5-8×10⁻¹¹ erg cm−2 s−1.
Note added 2015 Jan 16: The HEXTE source spectral files for 1ES1101−232, 4C71.07, 4U0241+61, Circinus, ESO103−G35, Mkn 3, Mkn 348, and NGC 7172 had improperly-set values for the CORRSCAL keyword (the values should be 0.0, not 1.0). Files with corrected headers uploaded 2015 Jan 16.
We acknowledge support from NASA Award NNX11AD07G.
How to acknowledge use of this catalog: If you publish any data obtained from this web site, we would like you to include the following acknowledgment: "This work has made use of {lightcurves}{spectral files} provided by the University of California, San Diego Center for Astrophysics and Space Sciences, X-ray Group (R.E. Rothschild, A.G. Markowitz, E.S. Rivers, and B.A. McKim), obtained at http://cass.ucsd.edu/∼rxteagn/." Secondly, please also cite Rivers, Markowitz, & Rothschild (2013), ApJ, 772, 114. Finally, please send us an email (almarkowitz, rrothschild -at- ucsd -dot- edu) to let us know what you're doing; if you are doing an in-depth analysis and/or using multiple sources, we may like to discuss possible co-authorship. Thanks!
In the future, we will add 7-10/2-4 hardness ratio plots, as well as 10-18 keV PCA light curves and HEXTE light curves for selected bright sources.
IMAGE CREDITS: Centaurus A Dust Lane: European Southern Observatory;
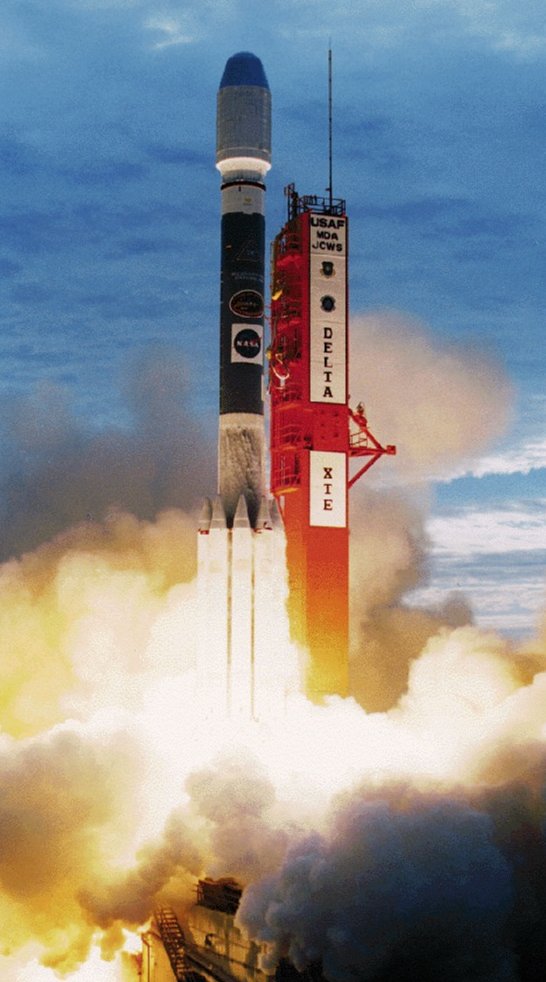
RXTE Launch: M.I.T. RXTE Group (xte.mit.edu);
Artist's Conception of RXTE in Orbit: NASA/GSFC
Last updated: 2015 Jan 17